The interface said 4.2x. The bank said 1.9x. Full autopsy of one Shopify account.
Stephan Ochse ·
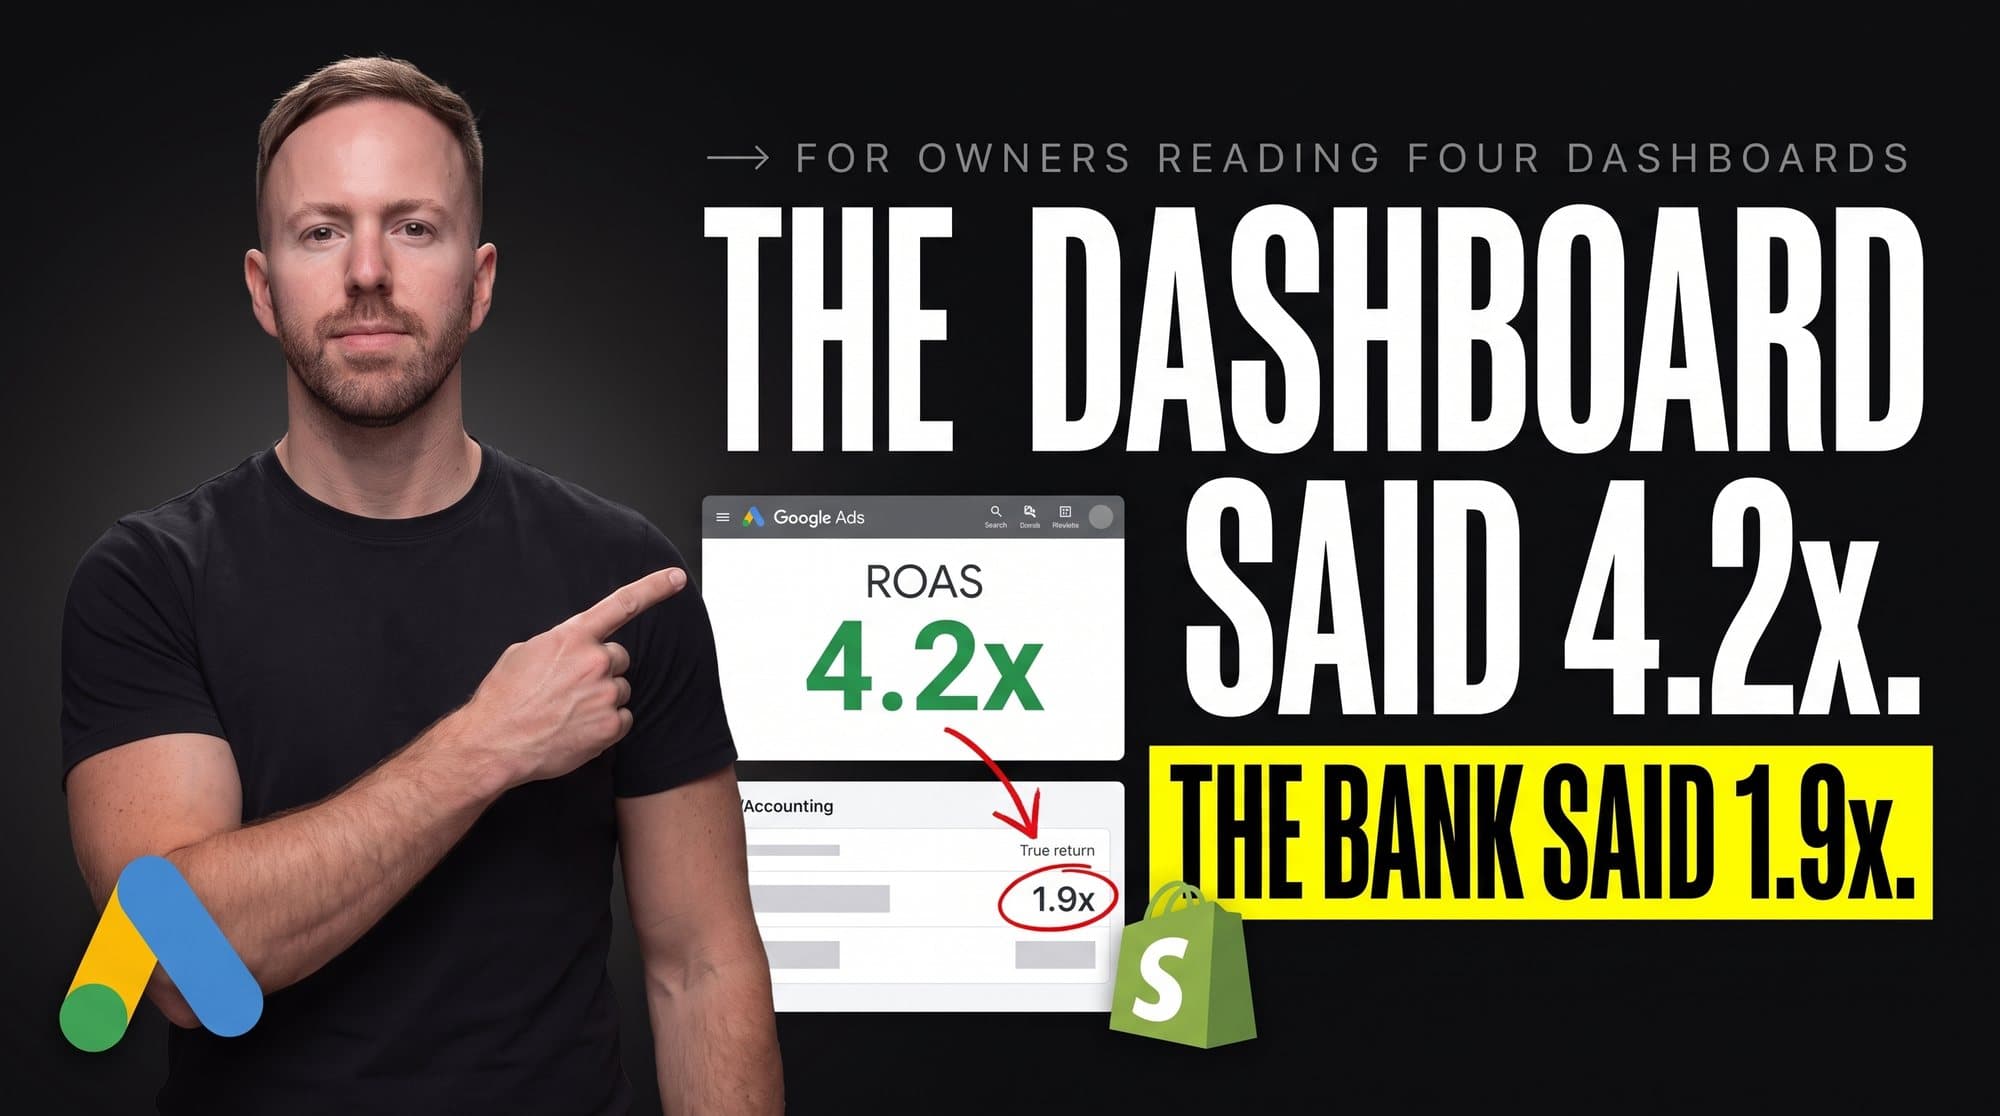
The Shopify dashboard said $85,000 a month. The Google Ads interface said 4.2x ROAS. The bank statement said 1.9x. The brand had been making budget calls on the first two numbers for over a year, and both were wrong.
This is the first teardown edition. One anonymous account from the book, opened start to finish: what the audit found, the order the fixes shipped, and what the numbers did across 90 days. The store name and every identifying detail stay blurred. The mechanics don't, because the mechanics are the point.
Some context on where this account sits. I run 100+ Google Ads accounts, with spend between $300k and $2.5M a month, through audit systems and AI agents rather than by living inside dashboards. This brand was one of the smallest in the book when it arrived. That's what makes it worth autopsying. An account this size bled in three places at once. A bigger account bleeds the same three ways with another zero on each leak.
[IMAGE-1: Hyper-realistic 16:9 annotated audit screenshot, the edition's main image. A split composite of two real product UIs side by side on a plain off-white #FAF7F2 surround: left panel is the Shopify admin Analytics overview with its real dark-sidebar chrome and the "Total sales" card reading "$85,412", right panel is the Google Ads Overview page with real left-nav chrome and Google Ads logo, its scorecard reading "Conv. value / cost 4.20". Store name, account name, and customer ID covered with soft gray gaussian blur bars in both panels. Over the composite, thick hand-drawn red marker circles around both numbers, a rough red marker line connecting the two circles, and scrawled all-caps marker handwriting between them reading "SAME ACCOUNT. SAME MONTH." with a second scrawl below reading "REAL: 1.9x". Every visible UI label real and correctly spelled, unimportant chrome rendered as soft gray bars, bottom tenth of the frame left clean for the footer composite.]
**The gap that opened the case**
Blended ROAS is the one number no attribution model can argue with: total revenue out of Shopify divided by total ad spend. Here that was $85k over $44k. Call it 1.9x. The Google Ads interface reported 4.2x over the same window.
A gap that size between platform and blended isn't an attribution nuance. It's a symptom. Something inside the account was manufacturing value that never reached the bank, and the audit found three leaks stacked on top of each other.
**Finding 1: every sale counted twice**
The conversions page had two purchase actions set to primary. One came from the Google Ads tag. One came from a GA4 import someone added during a platform migration and never demoted. Both fired on every checkout. Both fed value into Smart Bidding.
So the account's reported conversion value ran at close to double reality, and every tROAS campaign was hitting its 4.0 target on paper while delivering about half that in money. The bidding algorithm wasn't broken. It did what it was told with poisoned inputs. Feed Smart Bidding doubled value and it scales the loss.
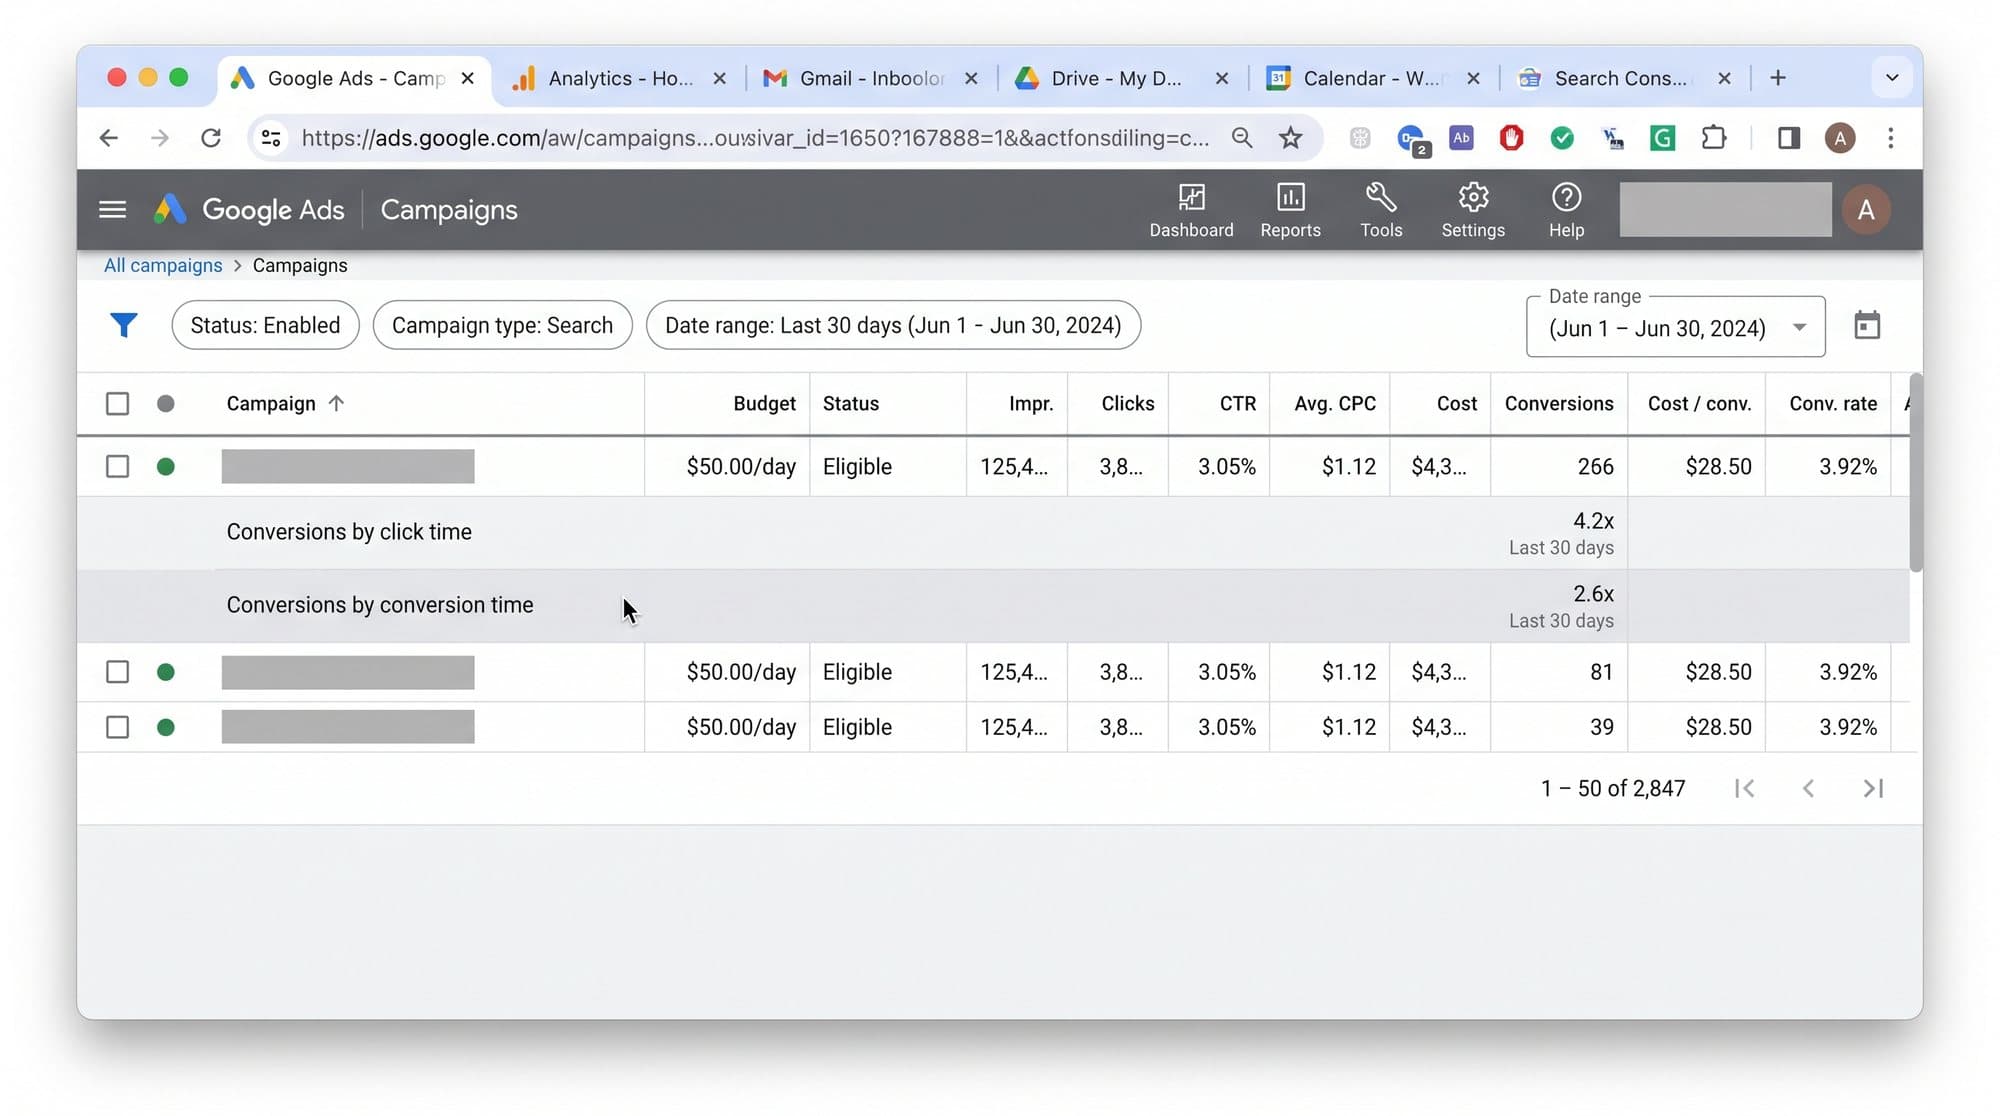
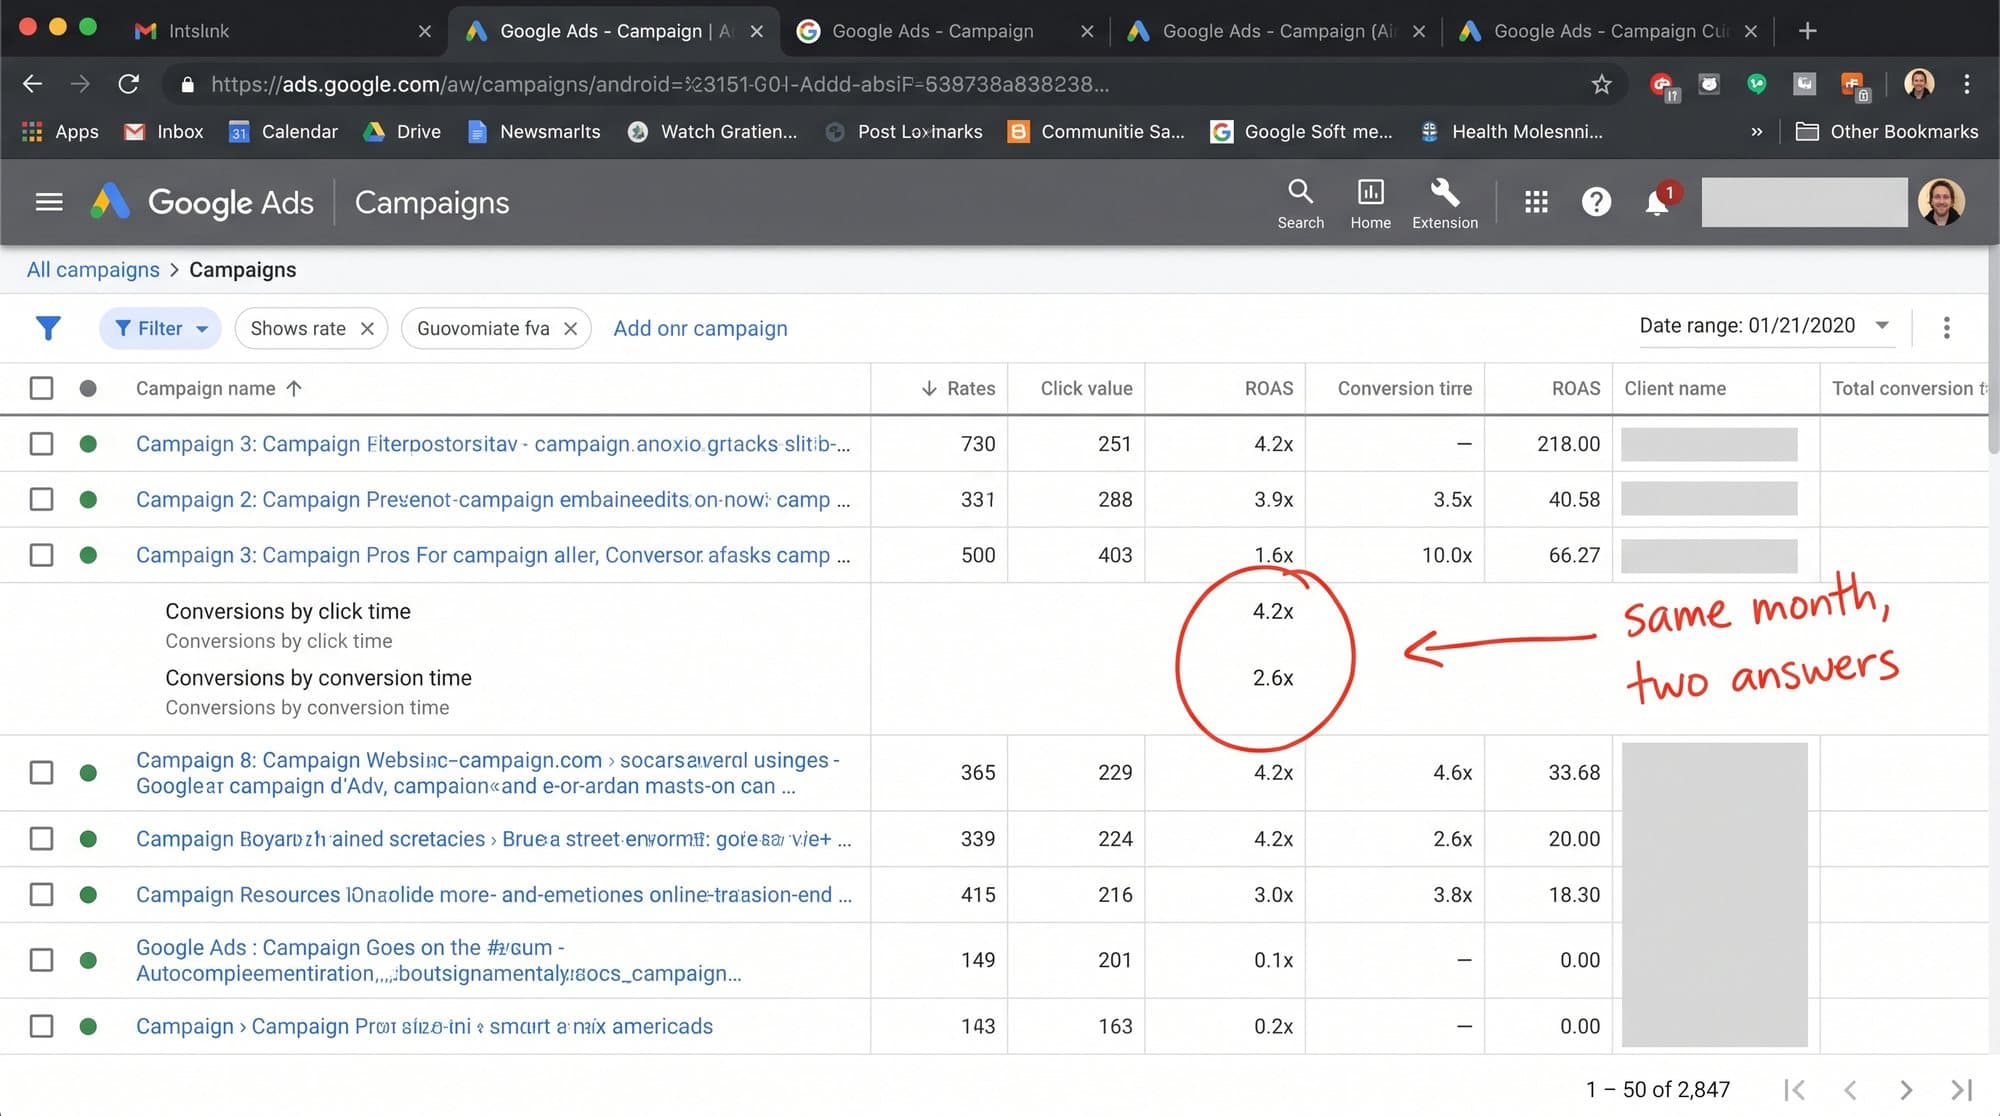
One detail made it worse: all reporting ran on click-time conversions. Purchase lag meant the last two weeks of any date range always looked soft, so the team had learned to ignore recent data, which is the data you need most when something breaks.
[IMAGE-2: Hyper-realistic 16:9 annotated audit screenshot of the Google Ads conversions settings page (Goals > Conversions > Summary), real left-nav and header chrome with the Google Ads logo, a conversion actions table showing two rows both named "Purchase": one with source "Google Ads tag (website)", one with source "GA4 (web) import", and both rows showing "Primary" in the action optimization column, with inflated totals visible in the "All conv. value" column. Account name and customer ID blurred with soft gray bars. Thick hand-drawn red marker circles around both "Primary" labels, a rough red marker bracket joining the two rows, and scrawled marker handwriting to the right reading "COUNTING EVERY SALE TWICE" with a smaller scrawl beneath reading "bidding on fiction". All rendered UI text real and correctly spelled, bottom tenth of the frame clean for the footer composite.]
**Finding 2: the brand was buying its own name**
$9,200 a month, across the brand search campaign and PMax, went to people who had typed the brand's own name into Google. Those clicks reported 11x ROAS, the best-looking line in the account.
They were also the least incremental dollars in the account. Someone searching your exact brand name has already decided to visit you. Most arrive through the organic listing sitting one centimeter below the ad. Paying for that click re-routes a sale you already owned, then reports it as a win at 11x.
That 11x did a second kind of damage: it propped up the platform's blended average. Strip the branded rows out and the cold-traffic ROAS the brand thought it had fell apart.
[IMAGE-3: Hyper-realistic 16:9 annotated audit screenshot of the Google Ads search terms report, real table chrome with columns for search term, cost, conversions, and conv. value / cost, showing six to eight rows where the search term text itself is covered by soft gray blur bars (the branded queries stay anonymous), the cost column summing to a visible "$9,214" total row, and the conv. value / cost column reading "11.0" on the branded rows. Account identifiers blurred. A thick hand-drawn red marker circle around the "11.0" figure and a second circle around the cost total, a rough red arrow connecting them, and scrawled all-caps marker handwriting across the empty right margin reading "YOU'RE BUYING YOUR OWN NAME". Real Google Ads fonts, spacing, and chrome throughout, bottom tenth of the frame clean for the footer composite.]
**Finding 3: PMax was eating, not hunting**
PMax reported the strongest performance of any campaign type in the account. After the dedupe from finding 1 and a brand exclusion list from finding 2, its cold-traffic number came back: 1.4x.
The 4x story was never about new customers. PMax sat between existing demand and the checkout, on branded queries and warm remarketing pools, and took credit for revenue the brand would have collected anyway. Cannibalization always looks like performance in the interface. That's what makes it expensive: nobody investigates their best campaign.
**The 90-day sequence, in the order it has to run**
Measurement before money. Every fix that touches budget waits until the counting is clean, or you're reallocating on the same lies.
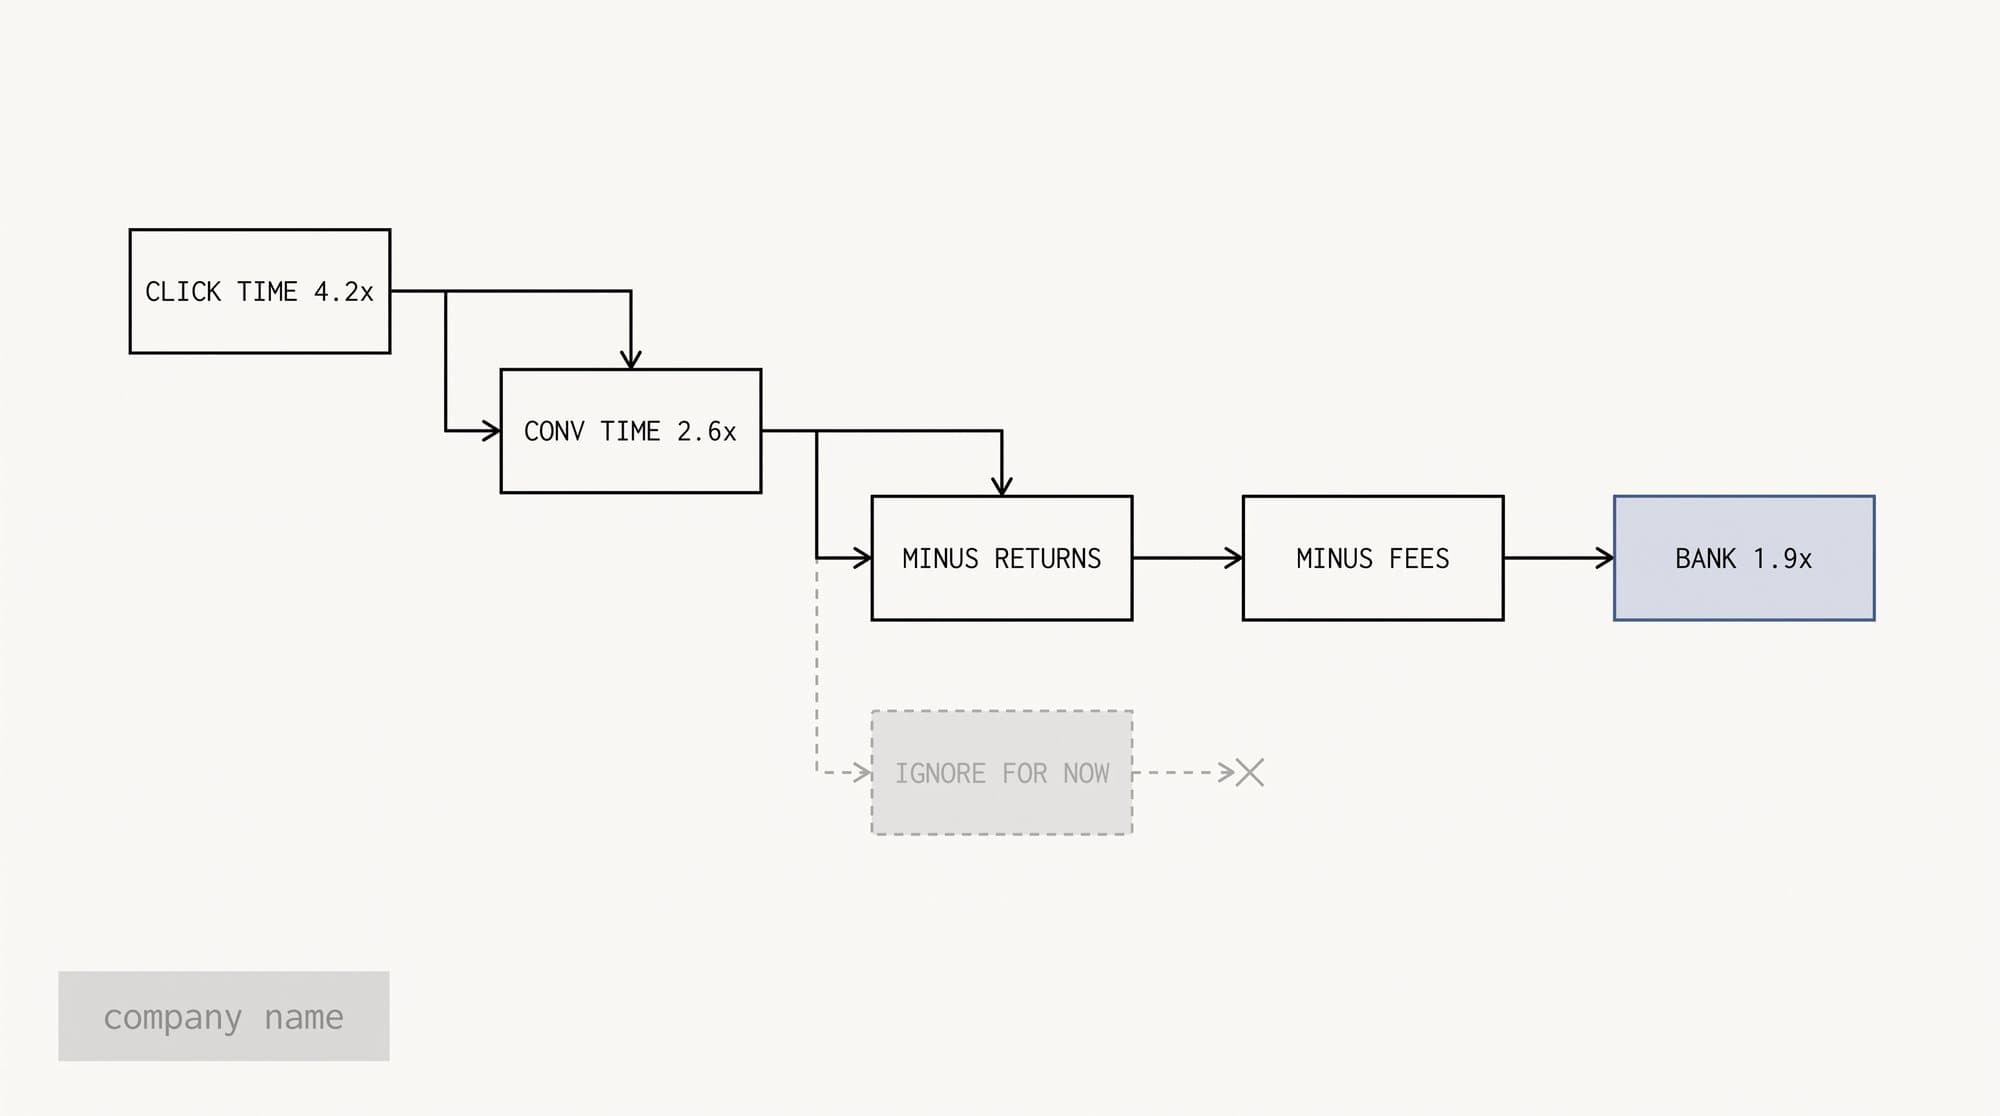
Days 1 to 14: fix the counting. One purchase action stays primary, the GA4 import drops to secondary. Reporting moves to conversion-time metrics across the account, so revenue lands on the day it happened instead of smearing back onto old clicks. No budget moves at all. Two weeks of clean data.
Days 15 to 45: brand hygiene. Brand exclusions go onto PMax. Branded search splits into its own campaign with a hard cap. Shopify's organic and direct channels get watched every day to confirm branded revenue holds without the paid crutch. It held, which is the usual outcome and still surprises every founder watching it.
Days 46 to 90: rebuild on real numbers. tROAS targets reset against clean conversion-time data instead of the phantom 4.0. The recovered $11k a month moves into non-brand search and a rebuilt PMax pointed at cold audiences with fresh creative. Scale follows the campaigns that prove incremental, not the ones that report prettiest.
[IMAGE-4: Hyper-realistic 16:9 annotated audit screenshot of the Google Ads campaigns table in its after state, real chrome and logo, date range selector reading "Last 30 days", the columns segmented to show "Conv. value (by conv. time) / cost" with the account summary row reading "3.10", campaign names and account identifiers blurred with soft gray bars, one non-brand search row and one PMax row showing healthy emerald-tinted upward delta arrows in the change column. This time the hand-drawn annotation is a thick emerald green marker circle around the "3.10" summary figure, with scrawled marker handwriting beside it reading "DAY 90. CONVERSION TIME. REAL." Real UI labels only, correct spelling everywhere, bottom tenth of the frame clean for the footer composite.]
**Day 90**
Same $44k budget. Revenue past $136k for the month. Blended ROAS at 3.1x, measured on conversion-time numbers, the strictest ruler in the drawer. No new product and no extra spend. The account grew because three leaks stopped and the freed money went where it earned.
If you run a store on Google Ads, two checks take ten minutes this week. Open Goals, then Conversions, and count how many purchase actions say primary. More than one and your ROAS is fiction. Then pull last month's spend on your own brand terms. If that number surprises you, the incrementality test will too.
Next teardown gets a bigger patient: an account spending over $400k a month where the leak wasn't in the settings, it was in the product feed. Reply with TEARDOWN if you want your account's symptoms opened up in a future edition, blurred and anonymous the same way this one was. I read every reply.